- PlotlyJapanese document is available
- PlotlySpanish document is available
- PlotlyChinese Simplified document is available
- PlotlyKorean document is available
¶ Overview
Plotly is an open-source data visualization library for creating interactive graphs, charts, and dashboards. It is available for use in web browsers, as well as through Python and R packages. Plotly is used by data scientists, analysts, and developers to create detailed visualizations of data.
¶ Description
Plotly is an open-source graphing library that allows users to create interactive, publication-quality graphs and charts. It is available in both web-based and desktop versions, as well as through Python and R packages. Plotly is designed to be easy to use and accessible to a wide range of users.
The library offers a wide range of chart types, including line charts, bar charts, scatter plots, histograms, and more. Plotly also offers a range of statistical and scientific charts, including box plots, heatmaps, contour plots, and 3D surface plots.
Plotly graphs can be shared and embedded on webpages, as well as exported in various formats such as PNG, PDF, and SVG. The library also supports real-time streaming of data, allowing users to create dynamic graphs and dashboards.
¶ Features
Plotly offers a range of features that make it easy to create interactive visualizations. These features include:
- An intuitive drag-and-drop interface for creating graphs and charts
- A wide range of chart types, including line charts, bar charts, scatter plots, histograms, and more
- Statistical and scientific charts, including box plots, heatmaps, contour plots, and 3D surface plots
- Ability to customize graphs with annotations, labels, and colors
- Ability to save and share graphs with others
- Ability to embed graphs in webpages
- Ability to export graphs in various formats, such as PNG, PDF, and SVG
- Real-time streaming of data to create dynamic graphs and dashboards
¶ Example
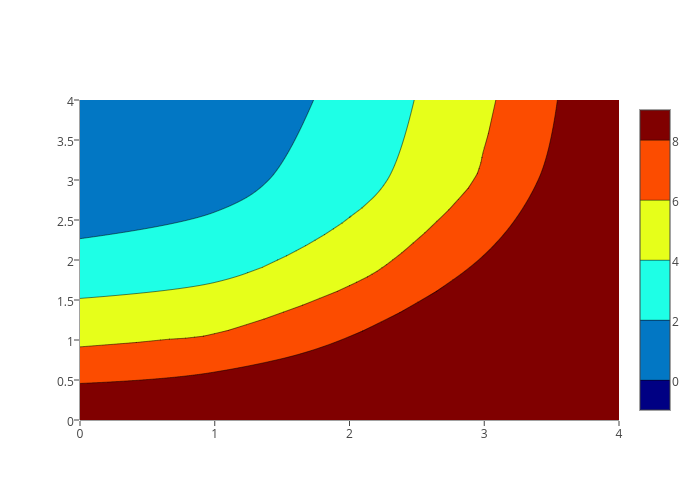
Here is an example of a line chart created with Plotly:
¶ Pros and Cons
Plotly offers a range of features that make it a powerful tool for data visualization. It is easy to use and accessible to a wide range of users. The library also supports real-time streaming of data, allowing users to create dynamic graphs and dashboards.
However, Plotly is not the only data visualization library available. Other libraries, such as D3.js, may offer features that are more suitable for certain types of visualizations. Additionally, Plotly is not free and may require a subscription for some features.
¶ Related Technology
Plotly is often compared to D3.js, a JavaScript library for data visualization. D3.js is a more powerful and flexible library than Plotly, but it is also more complex and may require more advanced coding skills.
¶ Digression
Plotly was founded in 2012 by Alex Johnson, Jack Parmer, and Chris Parmer. The company is headquartered in Montreal, Canada.
¶ Others
Plotly is used by data scientists, analysts, and developers to create detailed visualizations of data. It is used in a variety of industries, such as finance, healthcare, and education.