Prometheus is an open-source systems monitoring and alerting toolkit. One of the key features of Prometheus is its ability to collect metrics from various systems and sources.
¶ Collecting metrics
The principle behind Prometheus collecting metrics is simple: it uses a pull model, in which the Prometheus server periodically sends HTTP requests to scrape metrics from various endpoints, called "exporters", that are exposed by the monitored systems. The exporters are responsible for providing the metrics data in a specific format, such as a text file, that can be easily parsed by the Prometheus server.
About "Pull Model"
Prometheus uses a pull model for collecting metrics from various systems and sources. In a pull model, the Prometheus server periodically sends HTTP requests, called "scrapes", to exporters that are exposed by the monitored systems. The exporters are responsible for providing the metrics data in a specific format, such as a text file, that can be easily parsed by the Prometheus server.
The pull model has several advantages over a push model, in which the monitored systems send the metrics data directly to the Prometheus server. For example:
The pull model allows the Prometheus server to control the rate at which it collects metrics, and to adjust the rate based on the workload and resources of the server. This can help prevent the server from being overwhelmed by a large volume of metrics data.
The pull model decouples the Prometheus server from the monitored systems, and allows the server to collect metrics from any system that exposes an exporter. This makes the monitoring infrastructure more flexible and scalable, as it can be easily extended to support new systems and sources.
The pull model allows the Prometheus server to cache the metrics data and to perform transformations on the data before storing it in its internal time-series database. This can reduce the storage and processing requirements of the server, and allow users to store and query the metrics data more efficiently.
The pull model is an important aspect of the Prometheus monitoring system, and it enables the server to collect and store metrics data from various systems and sources in a scalable and efficient way.
About "Time-series Database"
A time-series database is a database that is specifically designed to store and analyze time-series data, which is data that is collected and stored over time. Time-series data is typically collected at regular intervals, and is often used to track the performance and behavior of systems, applications, or processes over time.
Time-series databases are optimized for storing and querying large amounts of time-series data, and provide features such as efficient data compression, fast writes, and support for complex queries and aggregations. They are often used in monitoring and analytics applications, where they can be used to track metrics such as system performance, resource usage, or business metrics.
Some examples of time-series databases include Prometheus, InfluxDB, and Graphite. These databases provide various features and capabilities, and are designed to meet the specific needs and requirements of different use cases and workloads.
The Prometheus server stores the collected metrics in its internal time-series database, and provides a rich query language and API for querying, analyzing, and visualizing the data. It also includes a alerting engine that can trigger notifications or take automated actions based on the collected metrics and user-defined rules.
Here is a more detailed explanation of the principle of Prometheus collecting metrics:
-
The Prometheus server is responsible for collecting metrics from various systems and sources. It does this by periodically sending HTTP requests, called "scrapes", to exporters that are exposed by the monitored systems. These exporters are responsible for providing the metrics data in a specific format, such as a text file, that can be easily parsed by the Prometheus server.
-
The exporters can be implemented as standalone processes, or as libraries that can be embedded in the monitored systems. They typically expose a HTTP endpoint that serves the metrics data in the Prometheus format, which consists of a set of metric names and corresponding values, along with optional labels that can be used to distinguish different instances or dimensions of the metrics.
-
The Prometheus server stores the collected metrics in its internal time-series database, which is optimized for storing and querying large amounts of time-series data. The database is organized as a set of blocks, each representing a fixed time interval, and each block contains a set of time-series data points that are stored as a matrix of metric names and labels.
-
The Prometheus server provides a rich query language and API for querying, analyzing, and visualizing the collected metrics. The query language, called PromQL, allows users to specify complex queries that filter, aggregate, and transform the metrics data in various ways. The API allows users to perform various operations on the collected metrics, such as retrieving the raw data points, exporting the data to external systems, or creating and managing alerts.
-
The Prometheus server also includes a alerting engine that can trigger notifications or take automated actions based on the collected metrics and user-defined rules. Users can define rules that specify when an alert should be triggered, based on the values of the collected metrics and their thresholds. The alerting engine continuously evaluates the rules against the collected metrics, and sends notifications or performs actions when the rules are met.
Overall, the principle of Prometheus collecting metrics is to provide a flexible and scalable way to monitor various systems and sources, and to enable users to easily query, analyze, and visualize the collected data. It allows users to understand the performance and behavior of their systems, and to identify and resolve issues before they become critical.
¶ Sample of Collecting Metrics
-
First, you need to install and configure the Prometheus server, and decide which systems and sources you want to monitor. This can involve setting up exporters on the monitored systems, or using existing exporters that are compatible with Prometheus.
-
Next, you need to specify the targets (i.e., the exporters) that the Prometheus server should scrape for metrics. This is typically done in the Prometheus configuration file, where you can specify the exporter URLs, the scraping intervals, and other options such as authentication or TLS settings.
-
The Prometheus server will then start scraping the specified targets at the configured intervals, and collect the metrics data in its internal time-series database. The collected metrics can be queried and analyzed using the Prometheus query language and API, or visualized using a dashboard tool such as Grafana.
Here is an example of a Prometheus configuration file that specifies two targets to scrape for metrics:
global:
  scrape_interval: 15s

scrape_configs:
  - job_name: my_system
    static_configs:
      - targets: ['localhost:9090', 'localhost:9191']
This configuration specifies that the Prometheus server should scrape the targets localhost:9090 and localhost:9191 every 15 seconds, and store the collected metrics in the time-series database. The targets can be exporters that are running on the local machine, or they can be remote exporters that are accessible over the network.
¶ Sample of metrics data
The syntax of the metrics is based on the Prometheus text format, which is a human-readable format that is used to expose metrics data over HTTP. The text format consists of lines of text that represent metric names and corresponding values, along with optional labels that can be used to distinguish different instances or dimensions of the metrics.
-
Metric names and types: Each metric is identified by a name and a type, which are specified using the
HELPandTYPEcomments. TheHELPcomment provides a brief description of the metric, while theTYPEcomment specifies the type of the metric, which can be one of the following:counter,gauge,histogram,summary, oruntyped. -
Labels: Each metric can have one or more labels, which are used to distinguish different instances or dimensions of the metric. Labels are specified as key-value pairs, with the keys and values being strings.
-
Metric values: Each metric has one or more values, which are specified as floating-point numbers. The values can be either instant values, which represent the value of the metric at a specific point in time, or cumulative values, which represent the total amount of the metric since it was reset or started.
About "Metric Types"
The TYPE comment in the Prometheus text format specifies the type of the metric, which can be one of the following:
counter: A counter is a cumulative metric that represents a monotonically increasing value. It is typically used to track the number of events or the total amount of a metric over time. Counters are reset to zero when the process that exports the metric restarts.
gauge: A gauge is a metric that represents a single numerical value that can arbitrarily go up and down. It is typically used to track the current value of a metric at a given point in time.
histogram: A histogram is a metric that tracks the distribution of a metric over a set of buckets. It consists of a set of cumulative counters for the number of events that fall into each bucket, as well as a sum and a count of the events. Histograms can be used to track the distribution of latencies or other metric values.
summary: A summary is a metric that tracks the distribution of a metric over a set of quantiles. It consists of a set of cumulative counters for the number of events and their sum, as well as a set of quantiles that can be used to estimate the distribution of the events. Summaries can be used to track the distribution of latencies or other metric values.
untyped: An untyped metric is a metric that does not have a type specified. It is typically used when the type of the metric is not known or when the metric is being used as a placeholder.The
TYPEcomment is optional, but it is recommended to include it in the metrics data to provide information about the type of the metric and how it should be interpreted. The type of the metric can affect how it is stored, queried, and visualized by the Prometheus server and other tools.
Here is an example of a metric with a single label and an instant value:
# HELP my_metric A metric that represents the number of requests
# TYPE my_metric counter
my_metric{method="GET", status_code="200"} 10
In this example, the metric is named my_metric and has the type counter. It has two labels: method, which has the value "GET", and status_code, which has the value "200". The value of the metric is 10.
Here is an example of a metric with multiple labels and cumulative values:
# HELP http_request_duration_seconds The HTTP request latencies in seconds
# TYPE http_request_duration_seconds histogram
http_request_duration_seconds_bucket{le="0.1"} 24054
http_request_duration_seconds_bucket{le="0.2"} 33444
http_request_duration_seconds_bucket{le="0.5"} 100392
http_request_duration_seconds_bucket{le="1"} 129389
http_request_duration_seconds_bucket{le="+Inf"} 133988
http_request_duration_seconds_sum 53423
http_request_duration_seconds_count 133988
In this example, the metric is named http_request_duration_seconds and has the type histogram. It has a single label, le, which has different values for each bucket (e.g., "0.1", "0.2", etc.). The values of the metric are cumulative counts of the number of requests that fall within each bucket. The metric also includes a sum and a count of the request latencies, which can be used to calculate the average latency.
¶ Appendix: Infrastructure
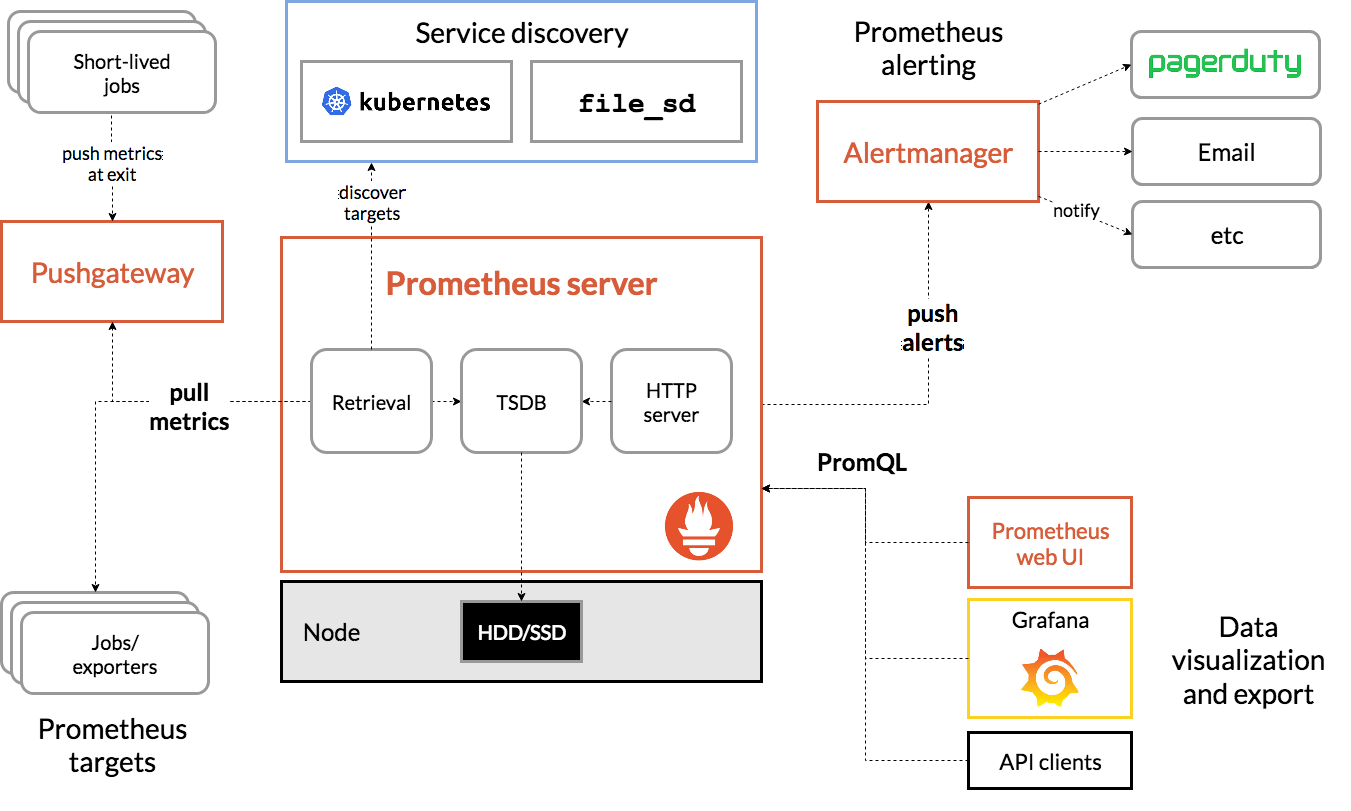
The structure of a Prometheus-based infrastructure typically consists of the following components:
Prometheus server: The central component of the infrastructure, responsible for collecting metrics from various systems and sources, storing the collected metrics in its internal time-series database, and providing a query language and API for querying, analyzing, and visualizing the data.
Exporters: Standalone processes or libraries that expose metrics data in the Prometheus format, and that can be scraped by the Prometheus server. Exporters can be implemented for various systems and sources, such as databases, networks, applications, or hardware devices.
Alertmanager: An optional component that can be used in conjunction with the Prometheus server to trigger notifications or take automated actions based on the collected metrics and user-defined rules. The Alertmanager receives alerts from the Prometheus server, groups them, and sends notifications or performs actions based on the configured policies.
Grafana: A popular dashboard tool that can be used to visualize the collected metrics and create interactive dashboards. Grafana can be integrated with the Prometheus server or Alertmanager, and can display the metrics data in various charts and graphs.
Monitored systems and sources: The systems and sources that are being monitored by the Prometheus server, and that expose metrics data through exporters. These can be servers, applications, databases, networks, or other types of systems and sources.
The structure of a Prometheus-based infrastructure is centered around the Prometheus server, which collects metrics from various systems and sources, and provides a rich query language and API for querying, analyzing, and visualizing the data. The infrastructure can also include additional components such as exporters, Alertmanager, and Grafana, which can be used to extend the functionality and capabilities of the monitoring system.